11 Best Shopify App Store Statistics 2026
Last modified: May 20, 2026
Shopify App Store statistics give store owners a clearer picture of what they’re walking into when they install their first app, and what’s reasonable to spend over a year. Below are 11 numbers worth knowing in 2026: how many apps actually live in the store, what the average store owner spends each month, how much developers make, and where reviews tend to land. Several of these numbers run against gut feel, most apps cost a few dollars rather than $20, and the average rating sits lower than you’d expect.
What Is the Shopify App Store?
The Shopify App Store is the marketplace where developers list paid and free Shopify apps, and where merchants install them on their stores. It covers email marketing, popups, inventory, reviews, shipping, and almost every other store function that isn’t built into core Shopify.
Apps come from Shopify itself and from independent developers. Most are subscription-based; some are one-off purchases or free with optional paid tiers.
So what are the main statistics that matter? Here they are.
1. About 87% of Merchants Use the Shopify App Store
Adoption is high but not universal. Roughly 87% of Shopify merchants install at least one app from the store. That means about one in eight store owners never use it at all.
Why might that be? Some stores are inactive or test stores. Some use all-in-one themes like Shoptimized or Booster that bake popular app features into the theme itself, so the App Store becomes unnecessary.
There are also ways to install certain tools outside the store. Apps like Vitals can be bought directly from the developer in some cases. So a small slice of stores genuinely operate without ever touching the marketplace.
2. There Are Over 8,000 Apps on the Store and Growing
The exact count is hard to pin down because apps are added and removed every week. Earlier counts pegged it at 6,000 to 8,000; the marketplace has continued to grow since then, with new apps shipping regularly.
The practical consequence: apps occasionally get pulled or unsupported. When that happens, functions can quietly disappear from your store. Keeping apps updated, and watching for “no longer supported” notices, is part of running a Shopify store at scale.
Most updates ship to fix security issues, not features. Skipping them is the most common reason store owners run into avoidable problems.
3. The Average Cost for a Shopify App Is $19.14
Most apps are paid. The mean monthly price is $19.14, but the median is just $4. That tells you the distribution is heavily skewed: a handful of expensive enterprise apps pull the mean up, while the typical app you install costs less than a coffee.
Most apps are built by independent developers, and subscriptions go directly to them. The top 25% of app developers earn around $167,000 a year from their apps.
Shopify, for its part, has reportedly earned about $100 million from app sales (its revenue share is taken on top of what the developer earns).
4. The Average Store Owner Spends $120 a Month on Shopify Apps
At about $120 a month, app spend is a real line item. For a typical store, this sits on top of the Shopify plan and any subscription theme, which means a merchant needs to clear about $200 a month in margin just to cover stack costs before any product margin counts toward profit.
Free trials soften the entry: many apps offer 7 to 30 days free, and a few use price matching to compete on cost.
Pricing varies sharply by category. Inventory management apps have a median of $17.98 but a mean above $100 because of enterprise tools at the top end. Reporting is the cheapest category, averaging around $5.
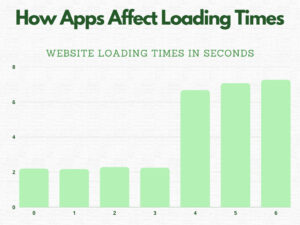
5. Nearly 62% of Third-Party Apps Will Slow Down Your Store
Research from Loox found that most third-party integrations measurably slow Shopify stores. The hit averages around 0.75 seconds per app on social/email integrations.
That doesn’t sound like much, but on Shopify each extra second of load time costs about 5% of revenue. The typical store runs about six apps. The math is brutal: a fully-loaded stack can quietly cost a store up to 30% of its potential revenue.
How? Many apps don’t just inject UI; they call out to their own servers to load popups, images, videos, recommendations, and reviews. Every external call costs time. The fix is selection discipline: install only the apps that pay back their cost in measurable conversion lift, and audit quarterly.
6. Only 1-3% of Users Will Review an App
Reviews matter for app developers, who depend on social proof to grow. Shopify takes a 20% cut of app subscriptions, so the developer keeps roughly 80% of each $5 subscription.
To clear the average developer salary of $93,000 a year from a single $5/month app, a developer needs around 2,000 active subscriptions.
Only 1-3% of merchants leave a review. So one visible review typically represents 33-100 actual installs. A developer aiming for a sustainable income needs roughly 20-60 reviews on an app for it to feel commercially proven. That’s reachable, but it takes time.
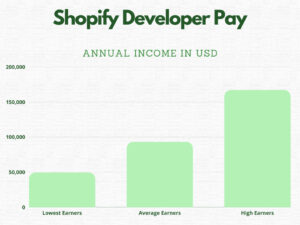
7. The Average Developer Earns $93,000 a Year from the Shopify App Store
The Shopify App Store supports a real working economy for developers. The bottom 6% earn $43,000 to $56,000. The average developer earns about $93,000 a year. The top performers clear $173,000 to $186,000.
There are two ways developers earn more. The first is to ship more apps, a portfolio approach where each app cross-promotes the others. The second is alternative revenue: Patreon, premium content, custom development services, or services on top of the free tier of an app.
About 0.18% of all app developers earn more than $1 million a year.
8. Marketing Apps Generate the Highest Revenue Per Listing
Marketing is the highest-earning category on the store. The average marketing app generates about $19,900 a year. Even so, that means a single-app developer would need roughly five marketing apps in that range to clear the average $93,000 salary.
Store design apps come in second, averaging about $13,500 per year.
Reporting is the lowest-earning category. That’s not necessarily a bad bet: some developers use a free reporting app as a loss-leader, then cross-sell premium apps to users who already trust the brand.
9. There Are 40-90 New Apps Launched Every Week
Between 40 and 90 new apps go live each week. Most struggle out of the gate. Across one tracked batch of 700 new apps over three months, the average earned about $39.72 in first-quarter revenue, and the median was $0.
The launch curve is steep: most apps either find a niche fast or fade.
10. The Average App Rating Is 2.96
The mean app rating is 2.96. The median is 4.2. That gap shows a small number of poorly-rated apps dragging the average down, most apps in the store sit at four stars or higher.
Counterintuitively, free apps rate worse than paid. The average free app sits at 2.38 (mean), 2.7 (median). Paid apps tend to be more polished, supported, and updated, which earns them better ratings.
There are about 579,000 reviews on the store. The average app has roughly 96 reviews, though the long tail varies wildly. Free apps make up just 105,000 of those reviews, so premium apps are roughly twice as likely to get a review, even adjusted for share of listings.
Apps in the merchandising category have the highest average rating at 3.38. Reporting sits at the bottom.
11. Category Mix Has Shifted Toward Sourcing and Store Design
Developers stick to the categories where demand sits. Before June 2021, the top categories were conversion and customer support. Since then, sourcing-and-selling and store design have taken the lead.
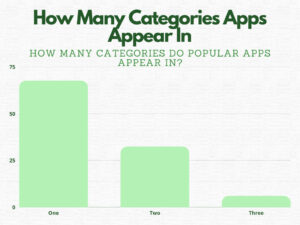
Some of that shift is a category-rules change: in June 2021, Shopify allowed apps to be tagged in multiple categories. Apps that span functions can now show up in two or three.
Around 32.4% of apps are now in two or more categories, 6.1% in three. The remaining 67.6% sit in a single category.
What These Numbers Mean for Store Owners
Three practical takeaways from these statistics:
- Budget realistically. Plan for $100-$150/month in app spend once your store is fully operational. That’s separate from your Shopify plan and any theme subscription.
- Audit for speed every quarter. With most apps adding measurable load time, the easy money is cutting apps you don’t actively need. A 1-second improvement typically returns 5-7% in conversion.
- Read reviews with the right lens. Only 1-3% of users review apps, so a paid app with 50+ reviews has likely processed thousands of installs. Look at recent reviews (last 90 days) more than overall stars.
| # | Name | Image | |
|---|---|---|---|
| 1 |

|
Sticky Cart & Sticky Add to Cart
|
|
| 2 |

|
One‑Click Checkout
|
|
| 3 |

|
Sticky Add To Cart + Buy Now
|
|
| 4 |

|
Buy Me ‑ Buy Button
|
|
| 5 |

|
Ultimate Sticky Add to Cart
|
|
|
Show More
|
|||
-
Is it easy to develop a Shopify app?
It is relatively challenging to develop a useful Shopify app because you need to know not just how to develop an app but also how you can build the app in the Shopify framework. You might also need to know how Shopify systems work to ensure you have an app that is functional for the merchants.
-
What royalties do Shopify take on the App store?
The Shopify app Store takes a 20% share in sales that are made on the Shopify app store. This can be done on a one-off basis and the subscription model. For longevity as a Shopify app developer, it is much better to charge a smaller amount on a regular basis (subscription) than to have a one-off charge that is very high.
-
How do you tell the quality of an app on the App Store?
There are numerous ways that you can tell whether an app advertised on the app store is any good. The first is to look at the features and ensure that it matches your need. Another is to read the reviews. Don’t just accept just one or two reviews, read them all and how the developer has responded.
-
How much should I budget for Shopify apps?
There are numerous budgets that could be considered for buying Shopify apps. For instance, those with low budgets might want to budget about $40 per month. However, the average budget for Shopify apps from the store is $120 per month.
-
How do you improve loading times after installing apps from the app Store?
Some speed reduction is often expected after loading several apps to the store. There are lots of great ways to improve website speed, however. There are apps that can do this, or you can use better images on the website.
-
Can apps be multi-functional?
There are many apps, like Vitals and Sales Rocket are multifunctional and can be a good way to save money and improve functions on the website. There are also apps that are multifunctional that have fewer than the 40 functions that are claimed by the aforementioned apps.
Conclusion: 11 Best Shopify App Store Statistics
The Shopify apps store is one of the best places to find apps that can help you improve the functionality of your website. There are lots of great statistics about installation through to cancellation that provide valuable market insights and performance data, helping you build a more effective store by choosing the apps that are best for you. And if you’re a developer, you can use these statistics to guide your Shopify app development business and achieve success.